FEDERAL TAXES & SPENDING · FY 2024
New York is a
net payer.
It paid more in federal taxes than it received in federal spending. Residents, businesses and governments combined.
FY 2024 · Source: NYS Comptroller, September 2026Net payer · FY 2024
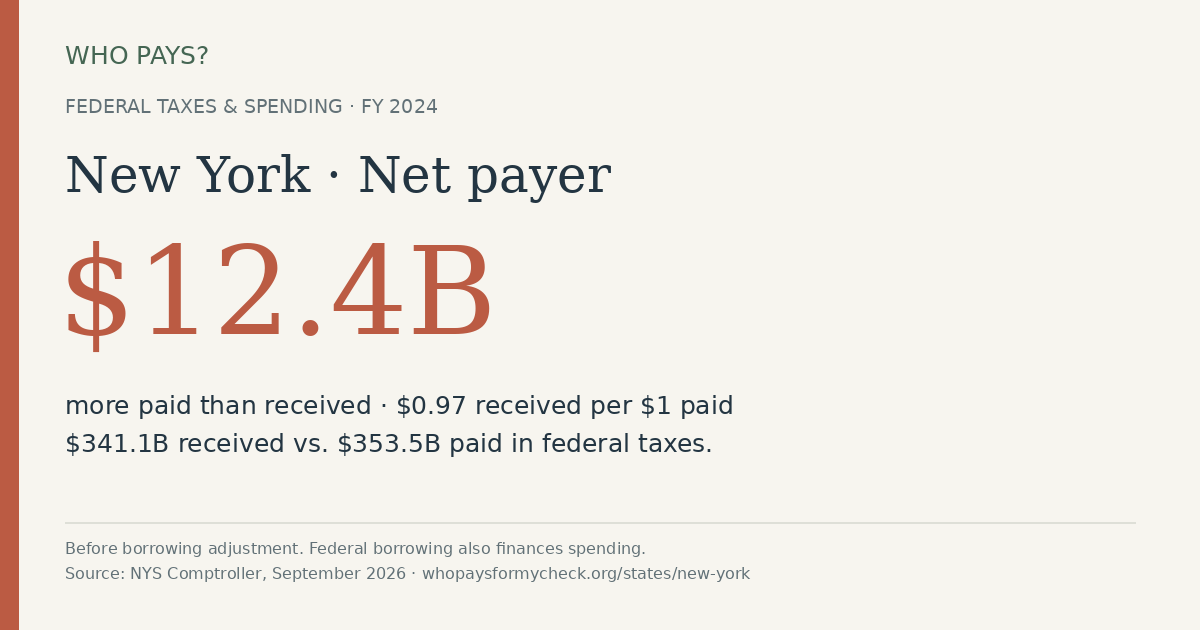
more paid than received
$341.1B received − $353.5B paid = −$12.4B net balance
Federal spending and taxes are attributed to the whole state. This annual balance is before any adjustment for federal borrowing.
Rank 45 of 50 by net spending inflow per resident.
$17,674 per resident
$17,056 per resident
$618 more paid than received per resident
Where the federal spending goes
| Category | Total | Per resident |
|---|---|---|
| Social Security | $83.2B | $4,161 |
| Medicare | $65.7B | $3,287 |
| Veterans’ benefits | $9.1B | $455 |
| Federal employee benefits | $4.3B | $215 |
| Other direct payments | $35.9B | $1,796 |
| Grants (including Medicaid) | $117.3B | $5,866 |
| Federal contracts | $15.1B | $754 |
| Federal wages and salaries | $9.7B | $486 |
| Other identified spending (EIDL loans) | $725.4M | $36 |
Total spending: $341,146,054,112. Display rounding can cause small apparent differences.
What do these figures mean for New York?
What does “net payer” mean?
“Net recipient” means allocated federal spending is greater than attributed federal taxes. “Net payer” means taxes are greater than spending. We use the unrounded dollar balance, not the displayed ratio, to choose the label. Borrowing is not allocated back to states as an additional tax.
Does New York pay more than it receives?
For FY 2024, attributed federal taxes exceeded allocated spending by $12,356,544,768. This is an annual balance, not an assessment of a particular household or a permanent label for the state.
What counts as spending received?
Payments include Social Security, Medicare, veterans’ and federal employee benefits, grants, contracts, salaries and other identified spending. Contracts and salaries pay for work. Federal facilities can provide benefits nationwide. “Other identified spending” includes EIDL loans; loan amounts are not ordinary grants.
How are the figures calculated?
Spending per tax dollar = allocated spending ÷ attributed taxes. Net per resident = (spending − taxes) ÷ population. Population: 20,001,419, the source’s July 1, 2024 estimate. FY 2024 runs October 1, 2023 through September 30, 2024.
Sources and limits
All figures use the same NYS Comptroller allocation methodology. Corporate tax attribution is an estimate and does not establish who ultimately bears that tax. The source excludes items such as federal debt interest, overseas spending and revenues not meaningfully assignable to these states. This is not the full federal budget or deficit. Per-resident figures include children and are not average benefit amounts per recipient.
Source report ↗Source workbook ↗Extracted figures and source hash ↗Full methodology ↗
State-by-state federal tax and spending results
Read each state’s figures, rankings, funding breakdown and sources.